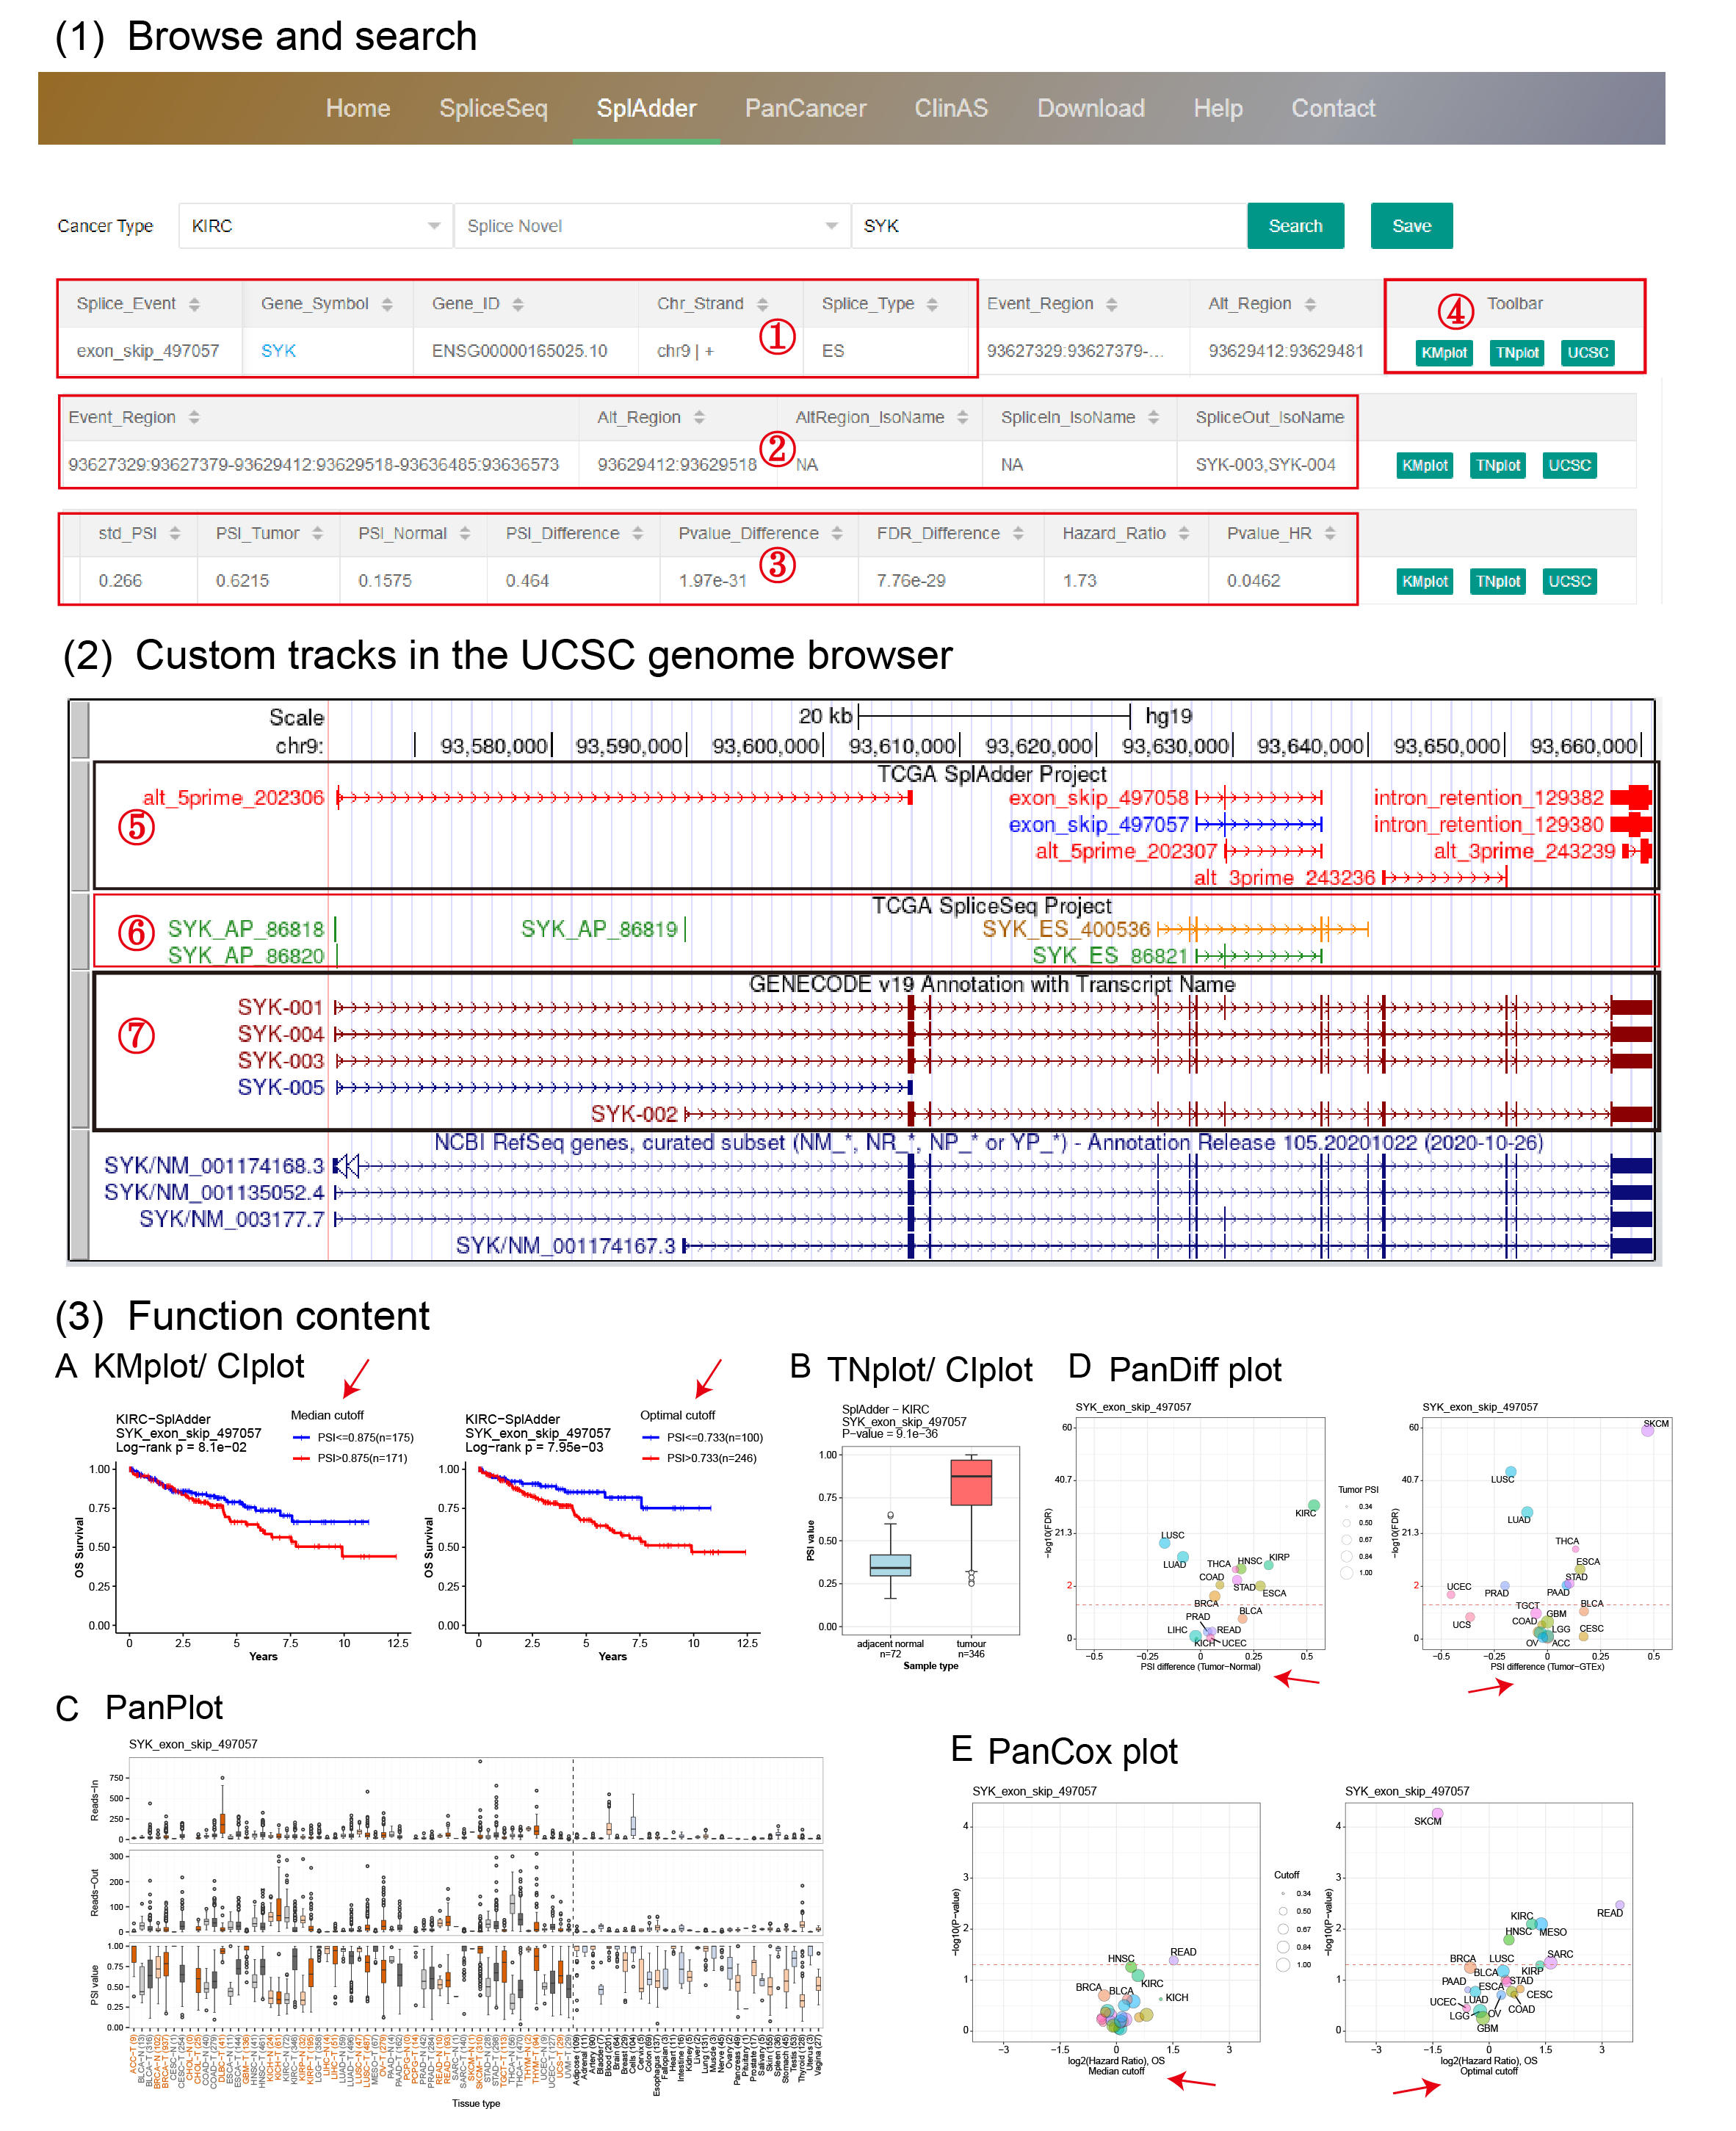
(1) After choosing a cancer type and searching a gene symbol, users can browse an integrative information of the queried splice events, including gene information ①, events information ② and statistical results ③. By clicking on a gene symbol embeded with the hyperlink, users are directed to the Ensembl database. In the button region ④, by clicking on the "UCSC" button users are directed to the UCSC genome browser, which is characterized by customized tracks with annotated structure of transcripts ⑦, and explanatory diagrams ⑤ ⑥ of detected AS events in the SplAdder and SpliceSeq projects. By clicking on a plot button, corresponding plot of querying will be presented in few seconds. ① and ② are consistently presented in different pages such as "SpliceSeq", "SplAdder", "PanCancer" and "ClinAS", while ③ and ④ might be different among them. For the SplAdder project, event region in ② was organized orderly by three or four exons (0 base start to end) based on chromosome locations from 5' to 3' and linked by "-", and alternate region was characterized as 0 base start to end of longer intron (A3 and A5), longer exon (IR) or alternate exon (ES and ME).
(2) Three customized tracks are provided in the UCSC genome browser, presenting explanatory diagrams and annotated structure of transcripts in the SplAdder and SpliceSeq projects. In the explanatory diagram track for SplAdder ⑤ and SpliceSeq ⑥, AS events in Blue or Green are indicated as annotated known AS events while AS events in Red or Orange are indicated as novel AS events. In the structural transcripts track for GENECODE v19 ⑦, transcripts in DarkRed are indicated as protein coding while transcripts in DarkBlue are indicated as non-protein coding. Thick blocks are indicated as alternate exon/exons of an AS event in the tracks with explanatory diagrams of AS events and are indicated as CDS region of a transcript in the tracks with annotated structure of transcripts.
(3) OncoSplicing provides six different plotting functions to visualize each AS event.
KM-plot produces two plots for most AS events based on the median PSI cut-off (left) and the predicted optimal PSI cut-off (right, if applicable). The optimal cut-off was predicted using survival data by the “surv_cutpoint” function in the R package “survminer”.
TN-plot provides boxplot to show the distribution of PSI in tumor samples and the comparison with adjacent normal samples (if applicable) and/or GTEx samples (if applicable). The Wilcoxon rank-sum test was used to evaluate the significance of differences.
PanDiff plot provides a pan-cancer view of PSI differences of the queried AS event (detected in at least 3 cancers) between tumor samples and adjacent normal samples (left, if applicable) and/or GTEx normal samples (right, if applicable). The red dashed line indicate 0.05 in the Y-axis. The red labels in axises indicate transformed breaks. The in-circle colors represent different cancer types.
PanCox (PanOS or PanPFI) plot provides a pan-cancer view of Hazard ratio of the queried AS event (detected in at least 3 cancers) based on the median PSI cut-off (left) and the predicted optimal PSI cut-off (right, if applicable). Survival data (OS or PFI) used in the plot was labeled in the X-axis title.
PanPlot produces boxplot to show PSI distribution of the queried AS event across different cancer types and GTEx tissues (SplAdder) and distributions of read counts supporting exon splice in or splice out (SplAdder). In the Figure (3)C, colored labels and black labels in the X-axis represent TCGA cancers and GTEx tissues respectively. The upper and middle parts labeled with "Reads-In" and "Reads-Out" in Y-axis represent read count value surport exon splice in or splice out respectively.
CIplot provides the visualization of significant PSI or survival differences between two subgroups of a selected clinical indicator, which are similar with KMplot and TNplot respectively.
If no data of the queried AS event could be displayed for a plot function, an empty plot with warning message will be presented.
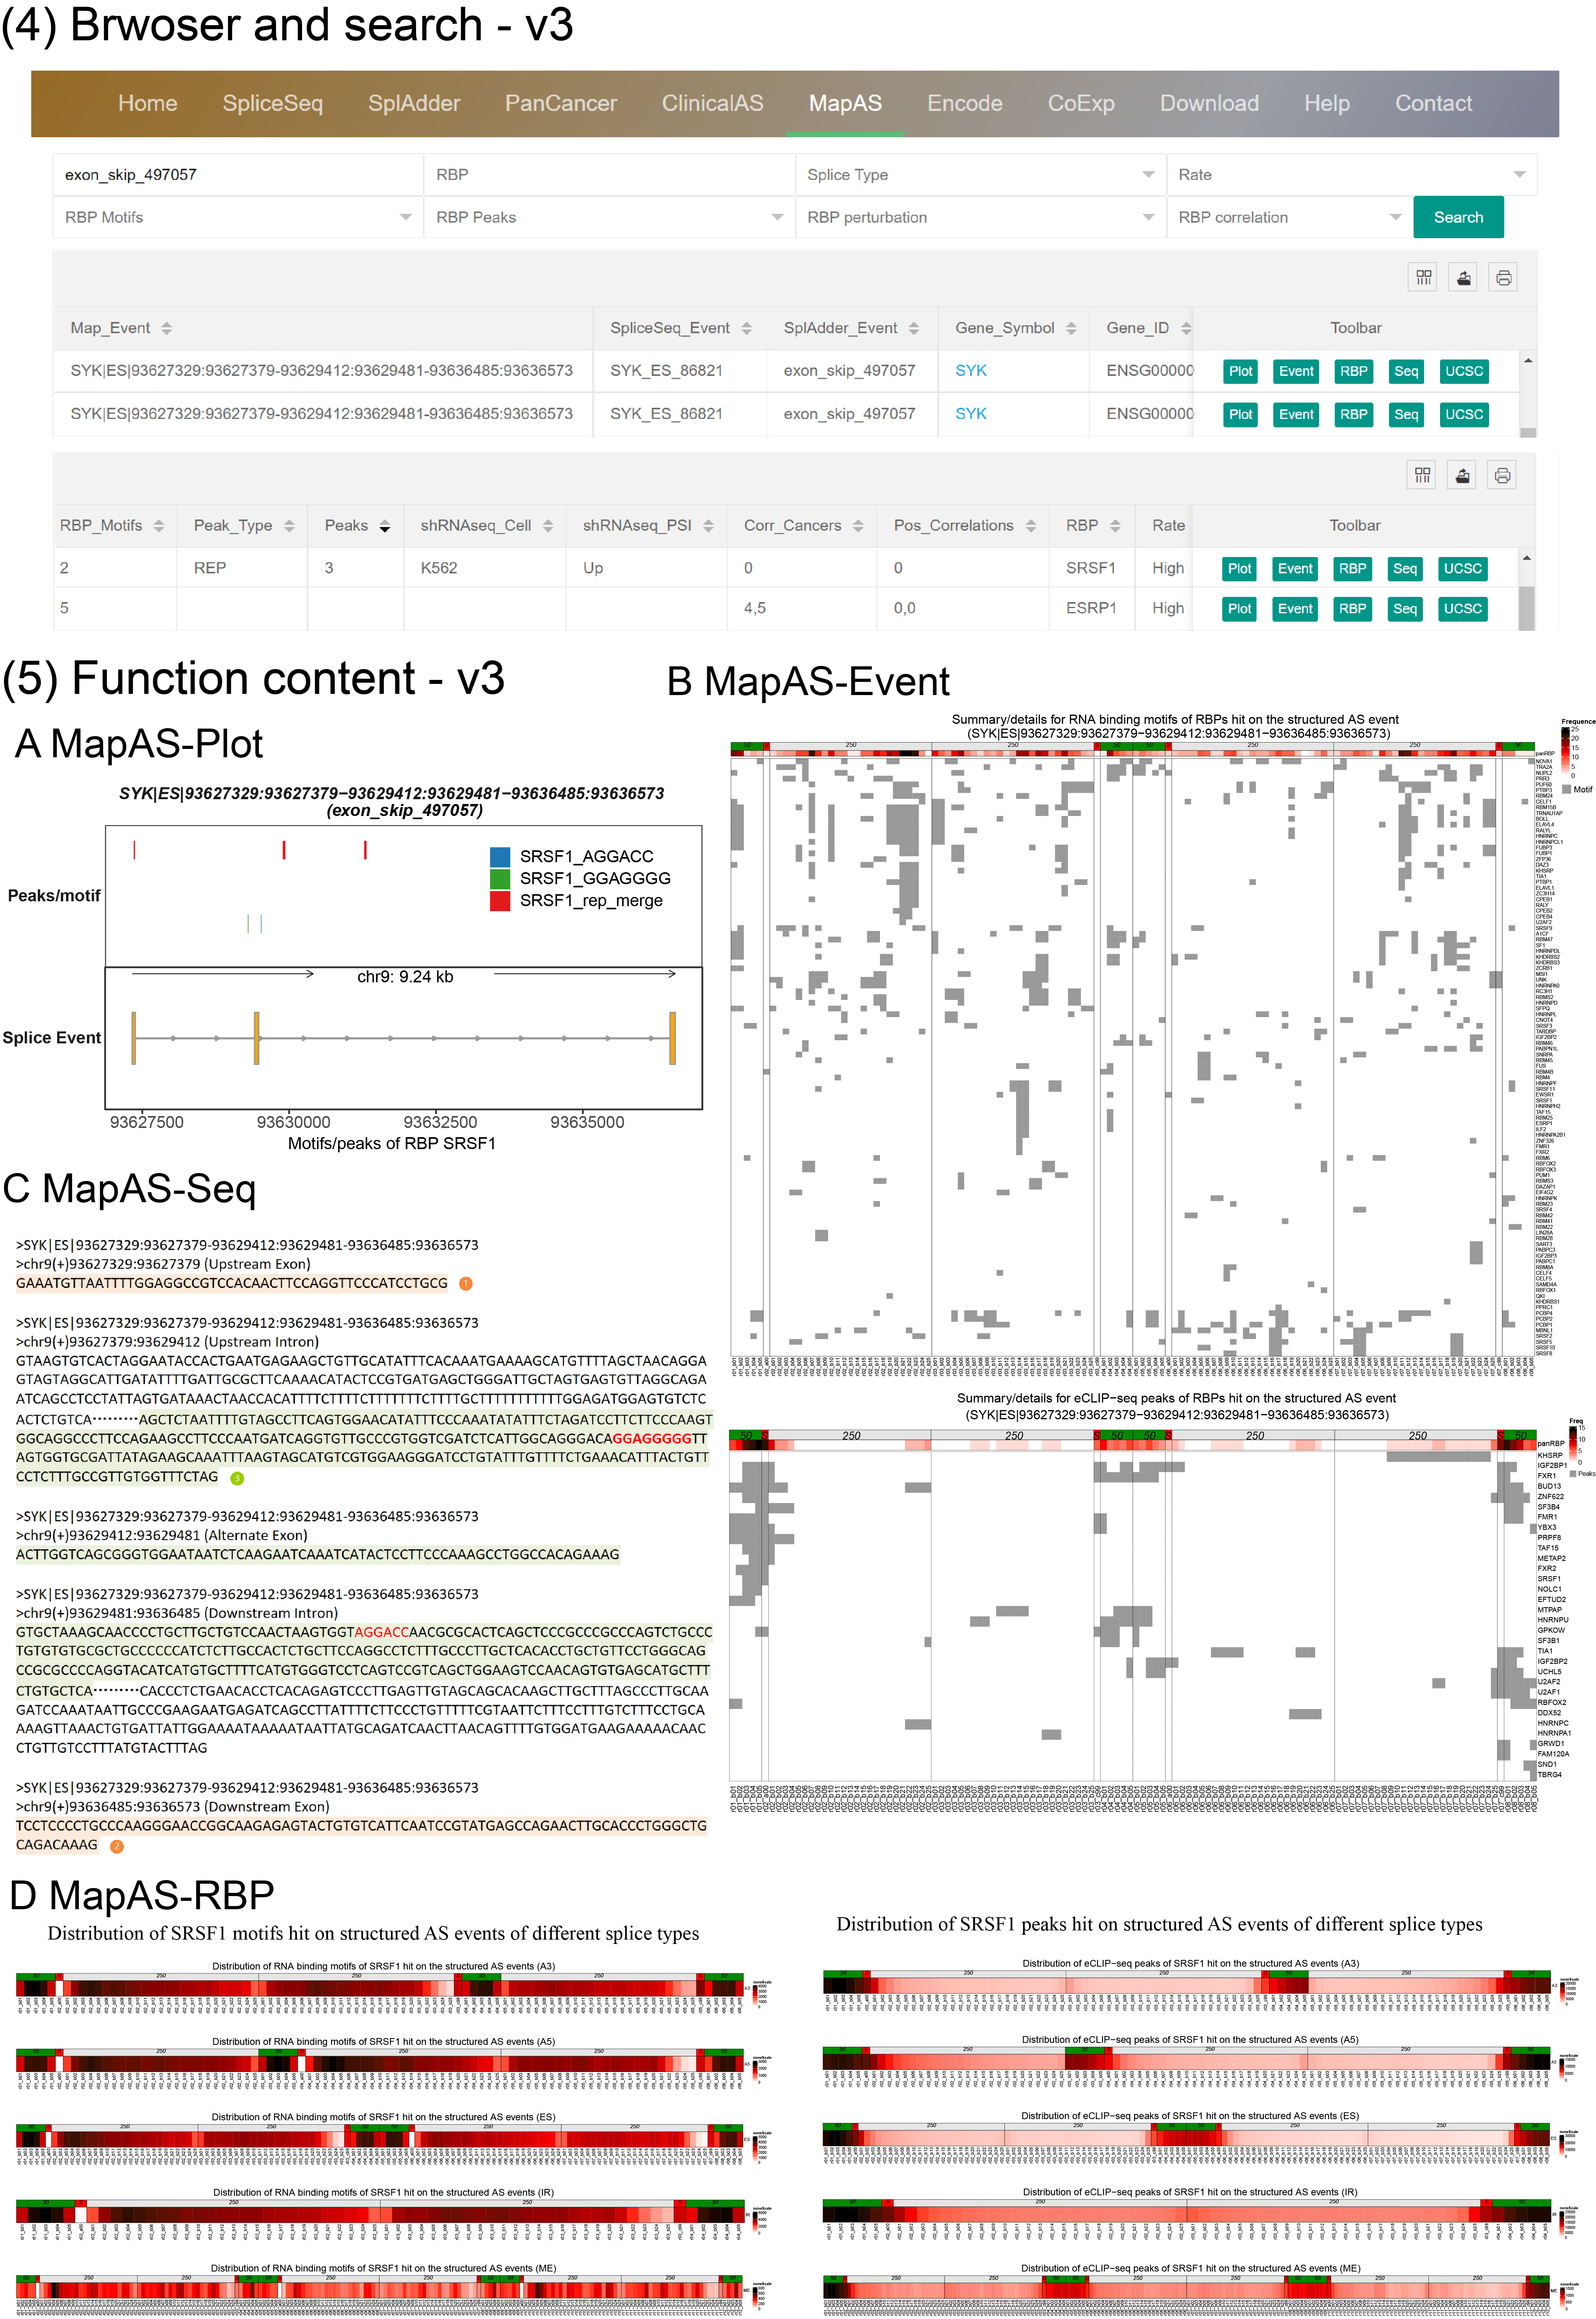
In the latest OncoSplicing database, users can explore potential splicing regulators of any AS events across the TCGA and GTEx cohorts.
(4) Browser and search By entering a splice gene, AS event or RBP on the MapAS page, users can view essential information of AS events, along with integrative data regarding hundreds of RNA-binding proteins (RBPs). The column "RBP_Motifs" indicates the number of RBP motifs identified in the queried AS event. "Peak_Type" and "Peaks" display the type and number of RBP peaks mapped to the event. The "shRNAseq_Cell" and "shRNAseq_PSI" columns represent the cell type and the corresponding PSI changes of the queried AS event, respectively. "Corr_Cancers" and "Pos_Correlations" list the number of cancers or tissues showing significant correlations and positive correlations, respectively. If two numbers are separated by a comma in the "Corr_Cancers" and "Pos_Correlations" columns, they represent data from the SpliceSeq and SplAdder projects, respectively. A "0" or "." in these fields denotes that the AS event has been explored, but no significant correlations were found, while an empty value ("") signifies a lack of supporting data.
(5) The latest OncoSplicing database introduces new features to explore the relationships between AS events and RBPs.
MapAS-Plot generates a structural representation of the queried AS event, highlighting the motifs and peaks of the selected RBP.
MapAS-Event generate heatmaps that display the location of RNA-binding motifs or eCLIP-seq peaks for all potential RBPs within the structured AS event (e.g., exon_skip_497057). To analyze the distribution of these motifs or peaks, 250 nucleotides on the intronic side and 50 nucleotides on the exonic side of the splice sites are included. The "PanRBP" row provides a summary of all RBPs that have motifs or eCLIP-seq peaks associated with the structured AS event. The grey color indicates sites with motifs or peaks. In the PanRBP row, darker shades represent a higher relative frequency of motifs for all RBPs.
MapAS-RBP generate heatmaps showing the relative distribution of RNA-binding motifs or eCLIP-seq peaks for a specific RBP across all structured AS events of various splice types. The darker the color, the higher the relative frequency of the RBP motif.
MapAS-Seq provides detailed sequences of the queried AS event, which can be used to design AS-specific primers and minigene constructs.
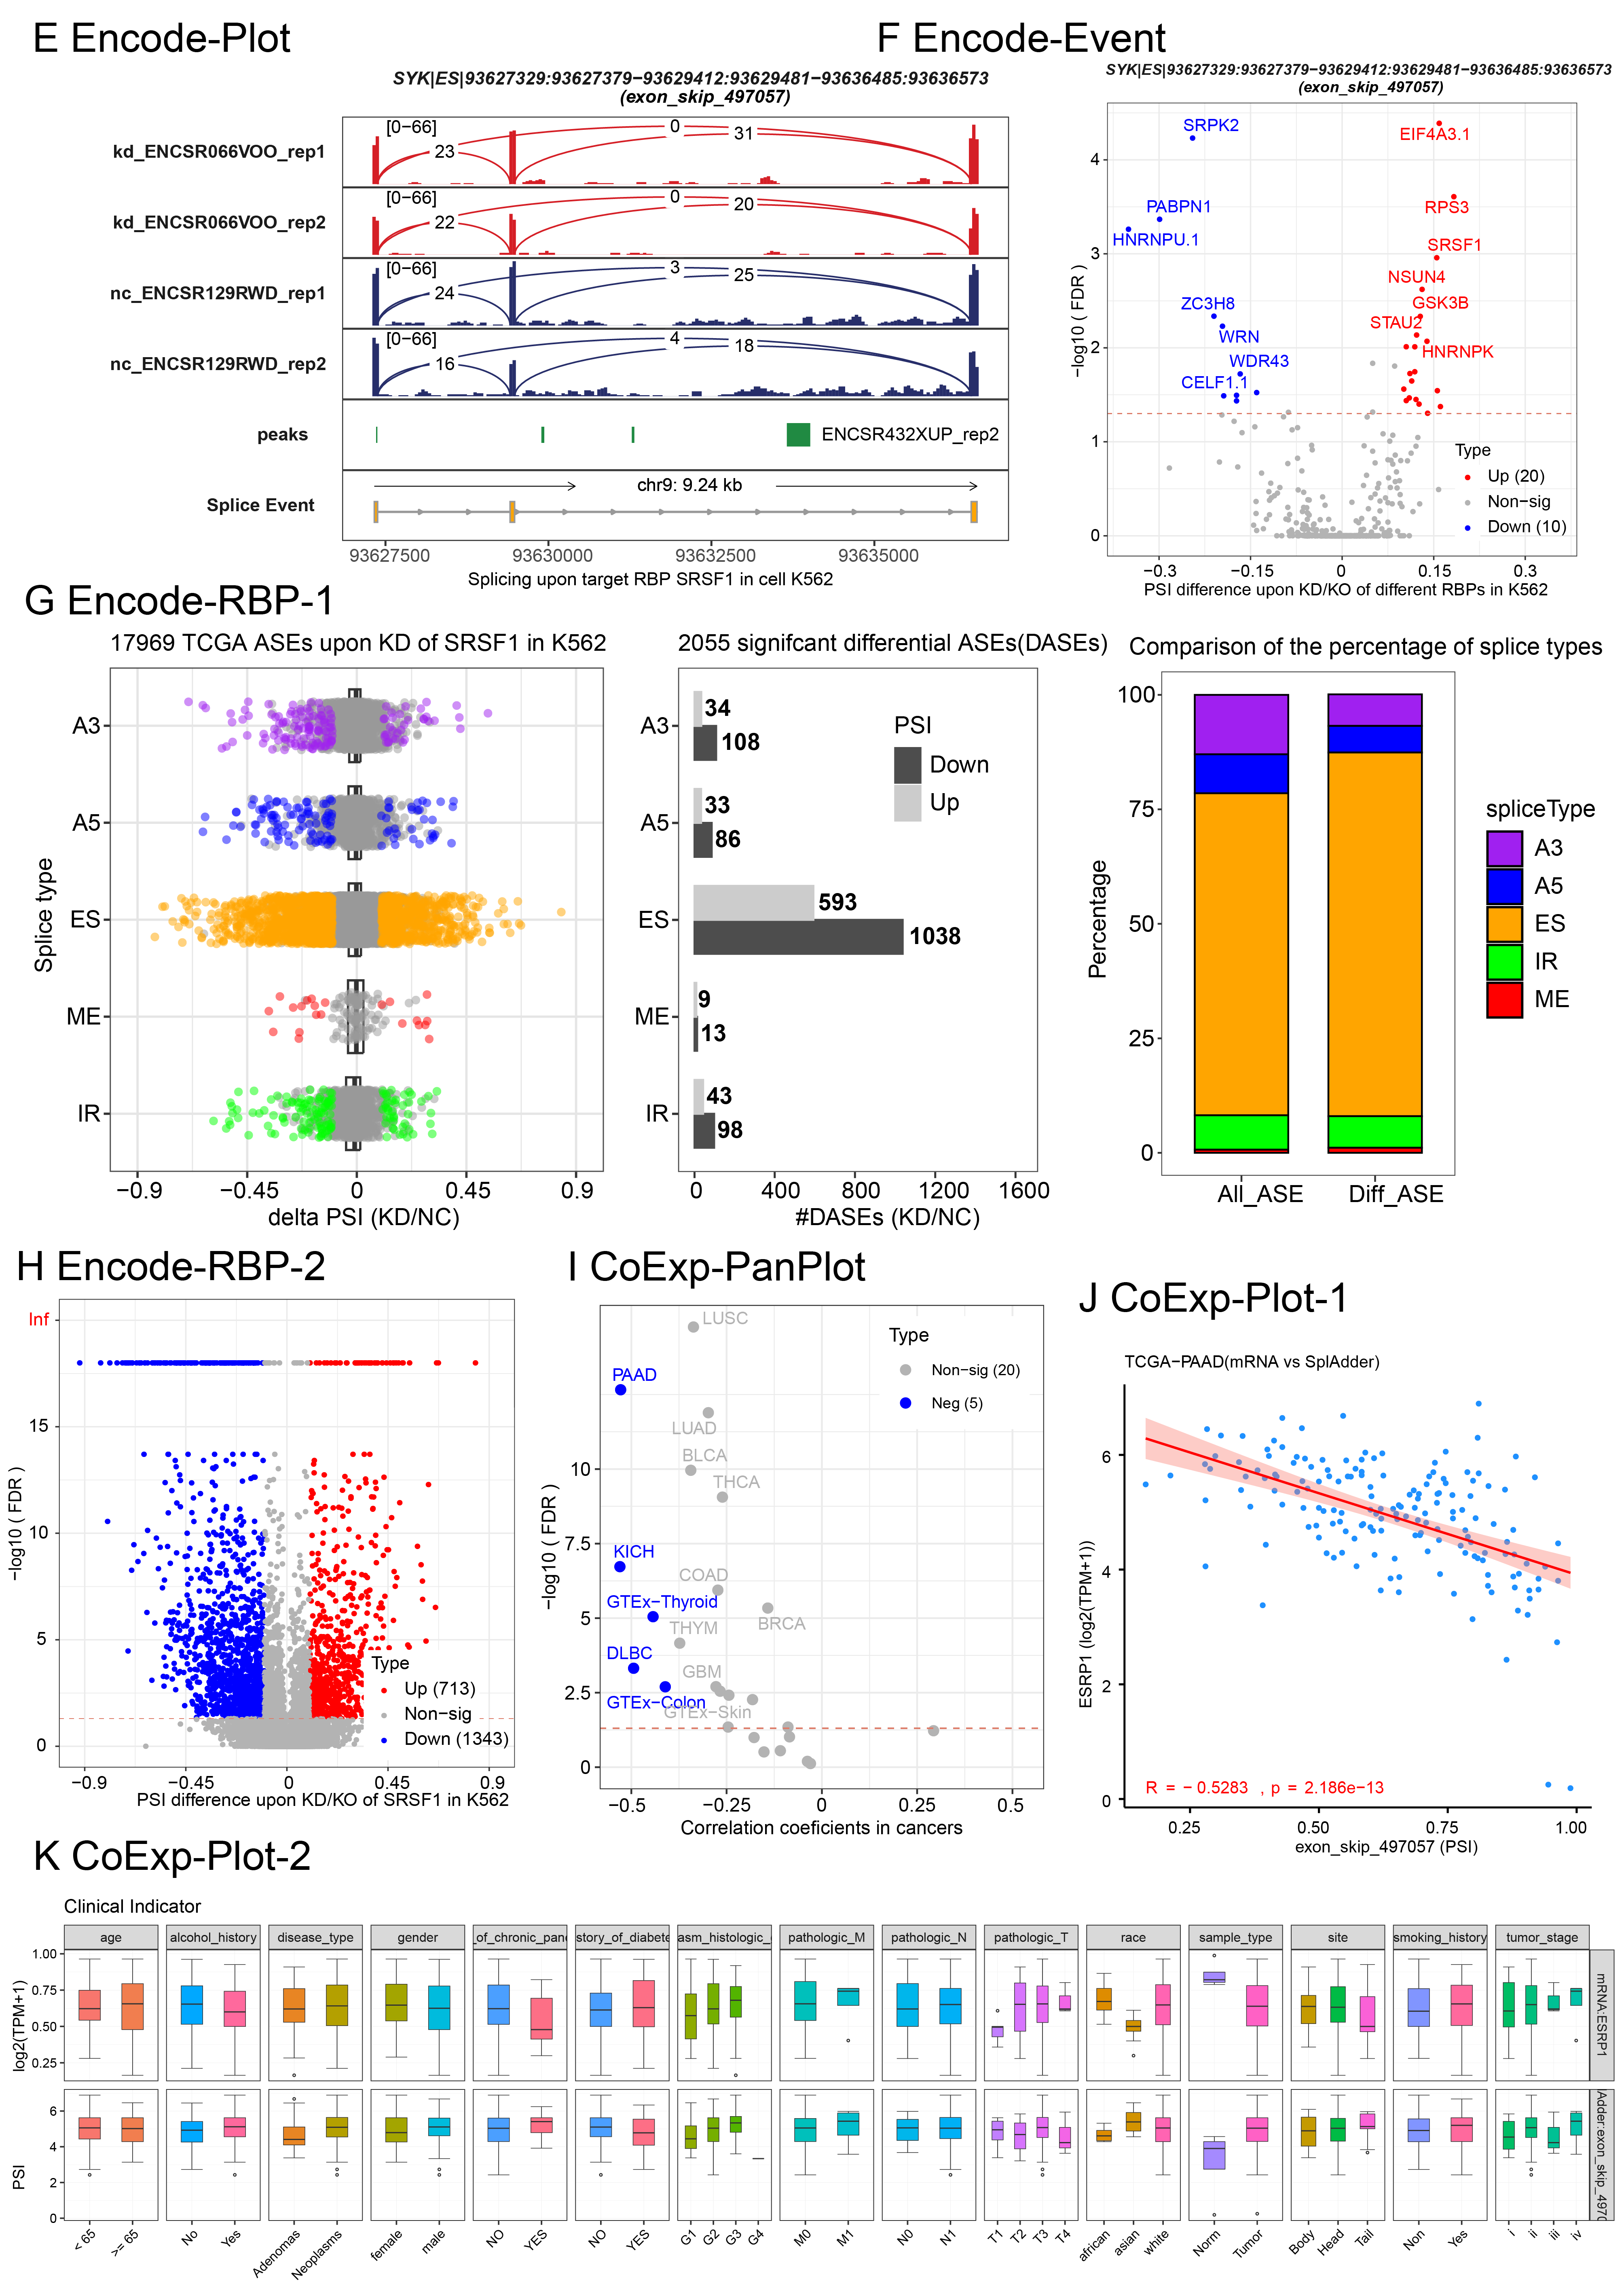
Encode-Plot generates a sashimi plot for the queried AS event based on bigwig score data and eCLIP-seq peak data for the selected RBP from the ENCODE project. (Note: this data may slightly differ from the PSI values calculated by rMATS.)
Encode-Event produces a volcano plot to identify RBPs that significantly regulate the queried AS event.
Encode-RBP generates several types of plots, including scatter plots, bar plots, and volcano plots, to illustrate the number, distribution, and overall landscape of AS events regulated by the selected RBP.
CoExp-Plot generates scatter plots to display the correlation between the queried AS event and the RBP within a specific cancer or tissue type. It also produces boxplots and time series plots that show the dynamics of both omics data across different time points and disease stages.
CoExp-PanPlot generates a scatter plot to visualize the correlation between the queried AS event and the RBP across user-filtered and selected cancer or tissue types.